Saturday, April 18, 2020

Project - Stage 3


This is the last part of the optimization project.
 I choose the "Zopfli" open source for optimization.
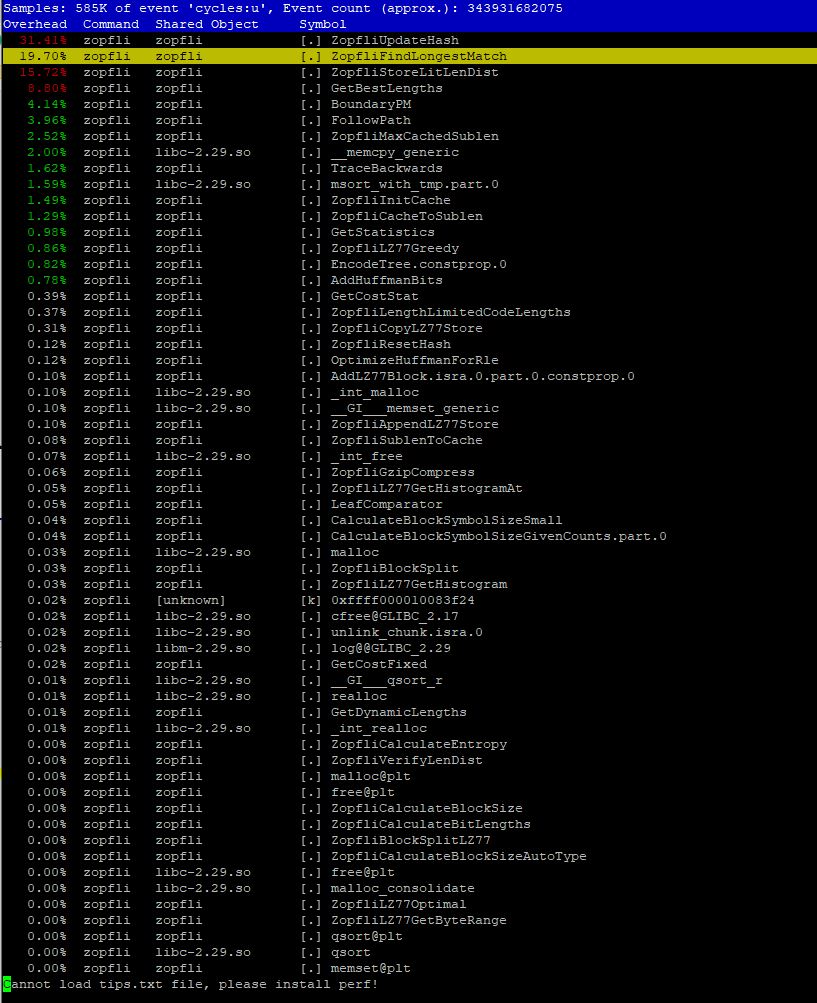
 As a result of profiling, the hottest part of Zopfli is the "ZopfliUpdateHash()" function.

 Here is the result of profiling.


Here is the hottest part in the "ZopfliUpdateHash()" function.

Here is the "ZopfliUpdateHash" function code in hash.c .


I plan to optimize "while loof" in this function as profiling result with several options. 

First, GCC optimization options.

When I change GCC option with -o flag,  the result is very interesting. I changed only the option 0 to 3 and fast, the results are quite different. when choose the -o fast, real and sys time is faster. Aslo, when compare option o0 to o3, when the option was increased, the speed also faster.
-O0- no optimization
-O1- first level optimization
-O2 – second level optimization
-O3 – highest optimization
-Ofast – optimize for speed only

time
-O0
-O1
-O2
-O3
-Ofast
real
3m39.489s
1m41.897s1m33.908s2m19,740s1m23.712s
user
3m39.023s
1m41.606s1m33.620s1m22.996s
 1m23.455s
sys
0m0.142s
0m0.127s0m0.138s0m0.163s0m0.119s


Second, Code Rewriting optimizations

* Original code
 while (pos + amount + 1 < end && array[pos] == array [pos + amount +1] 
           && amount < (unsigned short)(-1)){
             amount++;
}

1) Common subexpression elimination.

In this while loof code, subexpression(pos + amount +1) is evaluated twice. It could be evaluated once and used twice, saving an expensive it.

 size_t  newVal = pos +1; 
while( newVal < end && array[pos] == array[bewVa] && amount < )unsigned short)(-1){
           amount ++;
           newVal= newVal + amount  ;
}


2) Short Circuit

In this while loof, there are three conditions. when evaluating a condition with a logical AND, both halves of the condition must be true for the entire condition to be true. therore, it is not necessary to evaluate the second, third of the condition if the first is false.

 int  newVal = pose + 1; 
while( newVal < end){
while (array[pos] == array[bewVa]){
while (amount < )unsigned short)(-1){
           amount ++;
           newVal= newVal+ amount ;
}}}


Third,  SIMD

Vectorization  is the unrolling of a loop combined with the generation of packed SIMD instructions by the compiler. Because the packed instructions operate on more than one data element at a time, the loop can execute more efficiently. It is sometimes referred to as auto-vectorization, to emphasize that the compiler identifies and optimizes suitable loops on its own, without requiring any special action by the programmer.

 * Original code
 void ZopfliUpdateHash(const unsigned char* array, size_t pos, size_t end, ZopfliHash* h) { .......
   ......
   while (pos + amount + 1 < end &&
array[pos] == array[pos + amount + 1] && amount < (unsigned short)(-1)) {
amount++;
}
   .....
   ......
}

 * optimization code
Inform to the compiler that no overlap is possible. This is done in standard C by using the restrict qualifier for the pointers. 
 void ZopfliUpdateHash(const unsigned char* restrict array,  size_t  pos, size_t end, ZopfliHash* restrict h) { .......
   ......

__builtin_assume_aligned(array, 16);
__builtin_assume_aligned(h, 16);
   while (pos + amount + 1 < end &&
array[pos] == array[pos + amount + 1] && amount < (unsigned short)(-1)) {
amount++;
}
   .....
   ......
}

Finally, I will try to optimize "zopfliUpdateHash()" with below code.

 void ZopfliUpdateHash(const unsigned char* restrict array,  size_t  pos, size_t end, ZopfliHash* restrict h) { .......
   ......

__builtin_assume_aligned(array, 16);
__builtin_assume_aligned(h, 16);

size_t newVal= pos + 1;
   while (newVal < end ){
    while ( array[pos] == array[newVal ] {
     while( amount < (unsigned short)(-1)) {
amount++;
                newVal = newVal + amount  ;
}}}
   .....
   ......
}


What I learn...
During this project, I learned two things.
First, when I do coding, I have to think whether my code is optimized. My coding style can affect to the processing speed. so, during programming, I have to consider about the speed. Second, there are variety way for optimization. My optimization plan are some of them. I will try to learn other way. This project is very interesting.


Tuesday, April 7, 2020

Project - Stage2


1. Profile your software to identify where the software is spending its execution time and the amount of memory that the software is using. Perform this profiling using the test case you created in Stage 1, on both x86_64 and AArch64 platforms. Do not compare the absolute performance on different platforms, but do compare the relative performance on a given platform.

What is profiling?
profiling is a form of program analysis. It measures the time and space complexity of a program, the frequency of function calls and other info. profiling is mainly done with the thought of program optimization.

How get profiling?

1. To get the profiling I did the below steps with gprof.
What is Gprof: instrumentation and sampling. So it gives us a top-quality call graph, but, when we use this gprof we need special instrumentation code.
1) Modify the Makefile : add -pg option

2) Do "make clean"
3) Do "make all"
4) Do " gprof zopfilepndg gmon.out -p > result.txt "

Therefore I got the below profiles for each size and each server. 
AArch64 : 10MB

AArch64 :  20 MB

AArch64 : 30MB

X86-64 10MB

X86-64 20MB

X86-64  30MB

2. To get the profiling I did the below steps with perf.
* perf: This is not instrument only sampling. it does not give us call graph.
1) Modify the Makefile : remove -pg option. I added this option for gprof.
2) Do "make clean"
3) Do "make all"
4) Do "perf recode ./10mb.png 10test.png"
5) open the profiling "perf report"
6) I got profiling report.
* 10MB

*20MB

When you see the profile, first ZofliUpdateHash function is about 30% of running time and ZofliFindLongest funstion is 19% , ZofliStoreLitLenDsit function is 15%. However, when I profiling with Gprof, the most hootest function is ZofliFindLongest.
Therefore I will see more detail about ZofliFindLongest part.

* 10MB


* 20MB


3. Identify the functions or methods that are taking the majority of the CPU time.
The most of time are taken by 2 funcions. First one  is ZopfliFindLongestMatch. It tooks around 58%  of total time on x86-64server. (40% time of total  time on aarch server). Other one is encodeLZ77(univector*, Hash*, unsigned char const*, unsigned long, unsigned long, unsigned int, unsigned int, unsigned int, unsigned int). It tooks around 23% of total time on x86-64 server.( 13% of running time of total runnint time on aarch server). However, acording to the profiling with perf, the hottest funstion is ZofliUpdateHash(30%)  and second is ZopfliFindLongestMatch(19%). I will optimize one of those function for satage 3.

Monday, April 6, 2020

Lab 6 - Algorithm Selection Lab


In this lab, we will investigate the impact of different algorithms which produce the same effect.
We will test and select one of three algorithms for adjusting the volume of PCM audio sample based on benchmarking.

vol1.c : the basic or Navie algorithm
This approach multiplies each sound sample by 0.75, casting from signed 16-bit integer to floating point and back again. Casting between integer and floating point can be expensive operations.

vol2.c: A lookup-based algorithm
This approach uses a pre-calculated table of all 65536 possible results, and looks up each sample in that table instead of multiplying.

vol3.cA fixed-point algorithm
This approach uses fixed-point math and bit shifting to perform the multiplication without using floating-point math.


Make a prediction
we will process with 500000000 samples.
When I read the code vol3 and vol2 is similar and vol1 is most slow.
most of part of code is similar but, the "interesting part" slightly different.
In case of vol1.c, using the "data[x] = scale_sample(data[x], 0.75);" in the loop. However vol3.c using this calculation code "vf = 0.75 * 65536;" out of the loop and use the variable "vf" in the loop.


Here id the code we have for vol1.c 
// Function to scale a sound sample using a volume_factor
// in the range of 0.00 to 1.00.
static inline int16_t scale_sample(int16_t sample, float volume_factor) {
        return (int16_t) (volume_factor * (float) sample);
}

int main() {

        // Allocate memory for large data array
        int16_t*        data;
        data = (int16_t*) calloc(SAMPLES, sizeof(int16_t));

        int             x;
        int             ttl = 0;

        // Seed the pseudo-random number generator
        srand(1);

        // Fill the array with random data
        clock_t start, stop;
        int i;
        start =clock();

        for (x = 0; x < SAMPLES; x++) {
                data[x] = (rand()%65536)-32768;
        }
        printf("\n\n");
        stop = clock();

        // ######################################
        // This is the interesting part!
        // Scale the volume of all of the samples
        for (x = 0; x < SAMPLES; x++) {
                data[x] = scale_sample(data[x], 0.75);
        }
        // ######################################

        // Sum up the data
        for (x = 0; x < SAMPLES; x++) {
                ttl = (ttl+data[x])%1000;
        }

        // Print the sum
        printf("Result: %d\n", ttl);

        return 0;

}

Here id the code we have for vol1.c
[hskwon@bbetty algorithm_selection_lab]$ cat vol2.c
#include <stdlib.h>
#include <stdio.h>
#include <stdint.h>
#include "vol.h"

// Function to initialize the scaling table
static inline void scale_init(int16_t* table, float volume_factor) {
        for (int i=-32768; i<32767; i++) {
                table[(uint16_t) i] = ((float) i) * volume_factor;
        }
        return;
}

int main() {

        // Allocate memory for large data array
        int16_t*        data;
        data = (int16_t*) calloc(SAMPLES, sizeof(int16_t));

        int             x;
        int             ttl = 0;

        int16_t         table[65536];

        // Seed the pseudo-random number generator
        srand(1);

        // Fill the array with random data
        for (x = 0; x < SAMPLES; x++) {
                data[x] = (rand()%65536)-32768;
        }

        // ######################################
        // This is the interesting part!
        // Scale the volume of all of the samples
        scale_init(table, 0.75);
        for (x = 0; x < SAMPLES; x++) {
                data[x] = table[(uint16_t) data[x]];
        }
        // ######################################

        // Sum up the data
        for (x = 0; x < SAMPLES; x++) {
                ttl = (ttl+data[x])%1000;
        }

        // Print the sum
        printf("Result: %d\n", ttl);

        return 0;

}


Here id the code we have for vol1.c
[hskwon@bbetty algorithm_selection_lab]$ cat vol3.c
#include <stdlib.h>
#include <stdio.h>
#include <stdint.h>
#include "vol.h"

int main() {

        // Allocate memory for large data arrray
        int16_t*        data;
        data = (int16_t*) calloc(SAMPLES, sizeof(int16_t));

        int             x;
        int             ttl = 0;
        int             vf;

        int16_t         table[65536];

        // Seed the pseudo-random number generator
        srand(1);

        // Fill the array with random data
        for (x = 0; x < SAMPLES; x++) {
                data[x] = (rand()%65536)-32768;
        }

        // ######################################
        // This is the interesting part!
        // Scale the volume of all of the samples
        vf = 0.75 * 65536;

        for (x = 0; x < SAMPLES; x++) {
                data[x] = (data[x] * vf) >>16;
        }
        // ######################################

        // Sum up the data
        for (x = 0; x < SAMPLES; x++) {
                ttl = (ttl+data[x])%1000;
        }

        // Print the sum
        printf("Result: %d\n", ttl);

        return 0;

}


Build and test each of the programs
Find a way to measure performance without the time taken to perform the test setup pre-processing (generating the samples) and post-processing (summing the results) so that you can measure only the time taken to scale the samples. 

 I used below with #include <sys/time.h> .

Change the number of samples so that each program takes a reasonable amount of time to execute
* sample: 500,000,000
Arcitecture

1st
2nd
3rd
Aarch 64 - bbetty
Vol1
934.655029
935.343994
934.682007
Vol2
481.979004
479.429993
480.885986
Vol3
782.955017
782.963013
782.968018
X84-64 : xerxes
Vol1
342.062012
341.799988
342.772003
Vol2
273.645020
274.656006
  273.539001
Vol3
212.174011
212.164993
212.121002

* sample: 1,000,000,000
Arcitecture

1st
2nd
3rd
Aarch 64 - bbetty
Vol1
1871.629028
1871.630981
1870.562012
Vol2
85.615005
76.682007
73.014008
Vol3
1568.022949
1568.958008
1568.334961
X84-64 : xerxes
Vol1
682.671997
682.812988
683.776978
Vol2
546.969971
581.843018
548.658020
Vol3
425.340027
424.556030
425.140991


* sample: 2,000,000,000
Arcitecture

1st
2nd
3rd
Aarch 64 - bbetty
Vol1
3743.591064
3743.652100
3744.966064
Vol2
1099.267090
1089.684082
1064.688965
Vol3
3138.756104
3138.928955
3138.953125
X84-64 : xerxes
Vol1
1401.909912
1523.831055
1409.390015
Vol2
1119.677002
1138.452026
1105.764038
Vol3
874.038025
848.578003
873.478027

vol1 is most slow and vol2 is most fast in Aarch64 server. In xerxes server, vol3 is most fast and vol1 is most slow. When the number of samples was doubled (500,000,000 ->  1,000,000,000), the speed was also doubled. However, When the number of samples was increased 4 times(50,000,000 - > 20,000,000), the speed was also 4 times slower exept vol2. 

Memory usage of each program
Aarch64 : bbetty

X86-64 : xerxes

What I learn..
Even if we have same file, the running speed is different depending on the server.