1. Profile your software to identify where the software is spending its execution time and the amount of memory that the software is using. Perform this profiling using the test case you created in Stage 1, on both x86_64 and AArch64 platforms. Do not compare the absolute performance on different platforms, but do compare the relative performance on a given platform.
What is profiling?
profiling is a form of program analysis. It measures the time and space complexity of a program, the frequency of function calls and other info. profiling is mainly done with the thought of program optimization.
How get profiling?
1. To get the profiling I did the below steps with gprof.
What is Gprof: instrumentation and sampling. So it gives us a top-quality call graph, but, when we use this gprof we need special instrumentation code.
1) Modify the Makefile : add -pg option
2) Do "make clean"
3) Do "make all"
4) Do " gprof zopfilepndg gmon.out -p > result.txt "
Therefore I got the below profiles for each size and each server.
AArch64 : 10MB
AArch64 : 20 MB
AArch64 : 30MB
X86-64 10MB
X86-64 20MB
X86-64 30MB
2. To get the profiling I did the below steps with perf.
* perf: This is not instrument only sampling. it does not give us call graph.
1) Modify the Makefile : remove -pg option. I added this option for gprof.
2) Do "make clean"
3) Do "make all"
4) Do "perf recode ./10mb.png 10test.png"
5) open the profiling "perf report"
6) I got profiling report.
* 10MB
*20MB
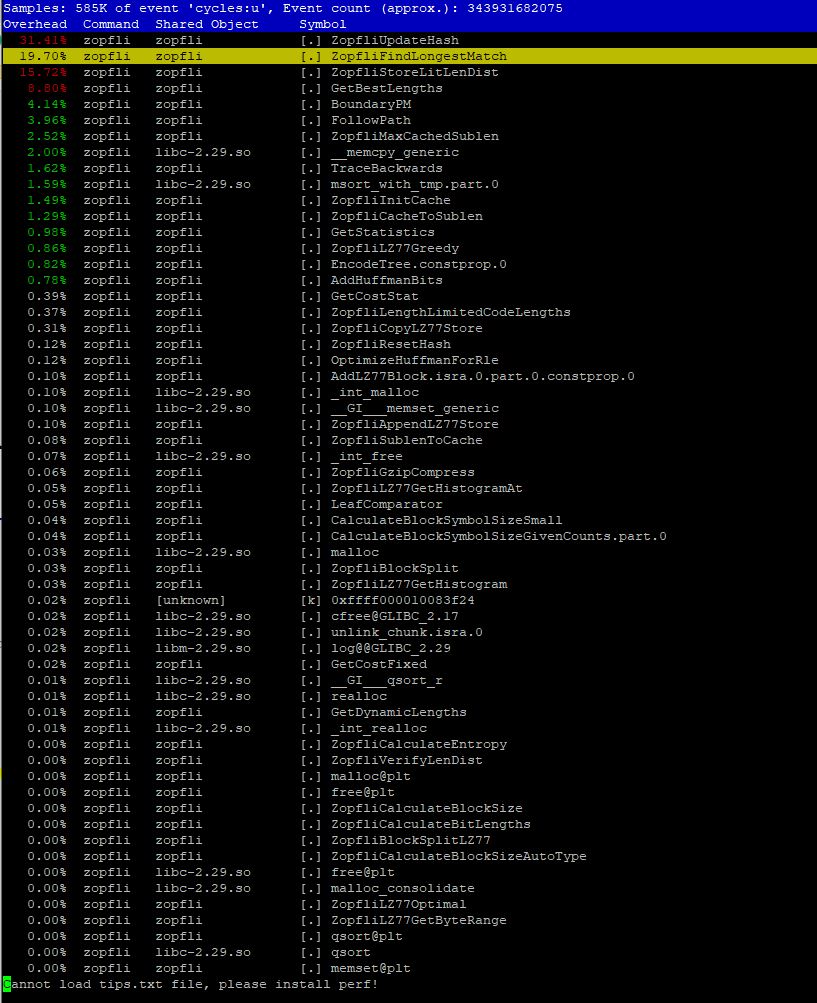
When you see the profile, first ZofliUpdateHash function is about 30% of running time and ZofliFindLongest funstion is 19% , ZofliStoreLitLenDsit function is 15%. However, when I profiling with Gprof, the most hootest function is ZofliFindLongest.
Therefore I will see more detail about ZofliFindLongest part.
* 10MB

3. Identify the functions or methods that are taking the majority of the CPU time.
The most of time are taken by 2 funcions. First one is ZopfliFindLongestMatch. It tooks around 58% of total time on x86-64server. (40% time of total time on aarch server). Other one is encodeLZ77(univector*, Hash*, unsigned char const*, unsigned long, unsigned long, unsigned int, unsigned int, unsigned int, unsigned int). It tooks around 23% of total time on x86-64 server.( 13% of running time of total runnint time on aarch server). However, acording to the profiling with perf, the hottest funstion is ZofliUpdateHash(30%) and second is ZopfliFindLongestMatch(19%). I will optimize one of those function for satage 3.


No comments:
Post a Comment